Utilizing technology to maximize your dental practice’s performance
Technology surrounds us and constantly provides analyses from every angle. How to interpret and use that data for the benefit of your practice can be overwhelming, but is essential to meeting your business goals and objectives. If you own your practice, you have probably spent countless hours looking at numbers trying to determine what you can do to increase profits, free up some of your time or get the most out of your hygienist. Your practice management software holds a tremendous amount of data, and when applied effectively, this data can provide valuable insight into your practice.
Dashboards – key performance indicators (KPIs) and benchmarking
In the past decade, we’ve seen major advancements in practice management software technology and it’s now easier than ever to extract meaningful data to use for key performance indicators (KPIs). Used primarily to measure and improve performance, KPIs are essential to driving your strategy and achieving your operational and financial goals.
When your practice’s data is accurately analyzed, organized and summarized, benchmarking and the use of KPIs can help identify areas of improvement and allow you to make adjustments that increase efficiency. Using KPIs ultimately allows you to focus your time on activities that improve your operations and increase profits. Making decisions without using KPIs as a benchmark can produce unnecessary trial and error and can sometimes take years to identify the actual culprit of an underperforming practice.
Real life examples
Below is an example how dental practices can use data to identify improvement areas and how pairing that data with industry benchmarks can help hone in on specific actions to take.
Example part 1: Practices using financial statements as a main source of information to make operational decisions can produce ineffective results.
Scenario A: A practice learned that advertising costs should be around 1% of production. Using this data as a benchmark, they discovered their advertising costs are at 3% and determine this as a potential area for savings.
Scenario B: Knowing the hygiene production to compensation ratio should be at least 3 to 1, a practice establishes that their hygiene department has room for improvement.
The numbers in the above scenarios provide useful information and point to some potential areas for improvement, however they only tell part of the story. Without additional data to apply in the context of their specific practice and its objectives, they’re left making educated guesses and applying process improvements through trial and error until results improve. Digging deeper into data and comparison against industry benchmarks can help direct process improvements and eliminate guesswork, as is illustrated in part 2 of this example.
Example part 2: Practices pairing the industry benchmarks from scenario A and B with data and information obtained from their practice management software can determine actionable steps and goals for their practice.
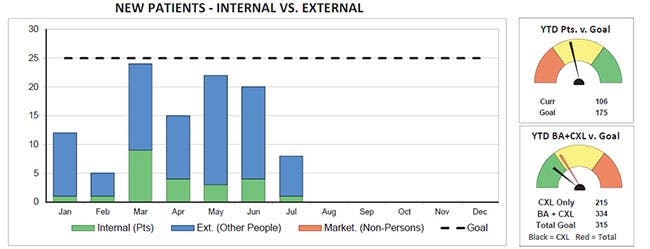
Scenario A: In scenario A in part 1, the practice drew the conclusion that they are likely spending more on advertising than necessary. To effectively track the impact of advertising dollars to acquisition of new patients requires multiple sources of information, including information on all potential efforts focused on bringing patients in (internal referrals, external referrals or general marketing efforts). Ideally, a practice’s point of contact asks for this information from a new patient and notes it in your practice management software.
By extracting this information and analyzing which sources are bringing in new patients and then comparing that data to industry standards, this practice may find that their advertising dollars are actually effectively resulting in new patients. If the practice is not experiencing significant growth from these new patients, this conclusion would lead the practice to review opportunities for improvement in other areas including patient retention and recare rates.
Scenario B: In our second scenario, the financials seem to indicate underperformance in hygiene. In many instances, this leads to reoccurring discussions in morning huddles centered around the need for improvement without actionable goals or improved results.
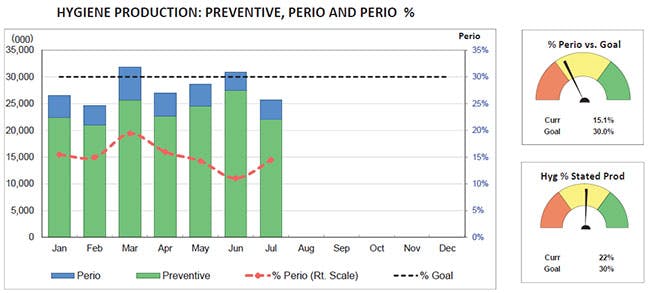
Identifying and analyzing useful data within your practice management software can lead you to inconsistencies or discrepancies in data that allow you to pinpoint true causes of the underperforming hygiene department. For example, after analyzing the extracted data, results show that only 3% of the hygiene department’s production is from perio, with your practice goal set at 10%. Using this information to analyze a specific service within the department, you can focus efforts to increase perio treatments by setting a specific goal. On the other hand, you uncover that three hygienists are meeting performance requirements while one specific hygienist has very low case acceptance rates and is therefore underperforming. This would allow you to focus your efforts coaching the underperforming hygienist on how to identify opportunities and increase case acceptance rates.
Analyzing financial data often identifies opportunities for improvement but does not give enough information to produce actionable solutions or insights to capitalize on opportunities. Greater results can be achieved by pairing industry benchmarks with data extracted from practice management software to use as your practice’s KPIs.
Extracting data to create dashboards
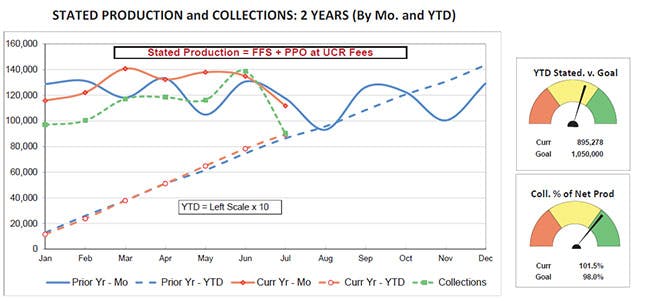
By utilizing specialized software, Baker Tilly’s dental services team works with practices to extract data from their existing practice management software to create a dashboard of various financial and operational benchmarks. A full report typically produces 40 pages of data analysis and graphs and a few sample dashboard charts are included below for reference.


For more information on this topic, or to learn how Baker Tilly dental specialists can help, please contact our team.
